When I talk about performance optimization in LabVIEW, I pretty quickly focus on memory management issues. Memory isn't the only concern. It's just that memory issues are sometimes the hardest to understand. Plus, since LabVIEW is a dataflow language, we have a lot of emphasis on the data.
One way to monitor memory usage in LabVIEW is to use the profiler.

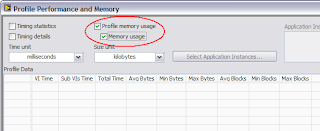
Select Profile Memory Usage to see how much memory each of your VIs is consuming.

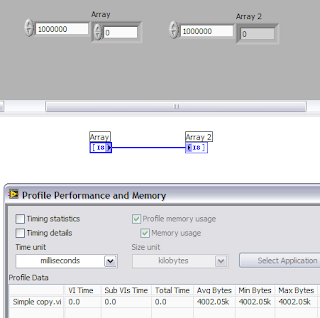
Here's a simple VI I wrote that contains an array control wired to an array indicator. I changed the data type of the array element to be a 1-byte integer. This makes it easy to see how much memory the array is taking--one million array elements equals one million bytes. (If we had an array of doubles, one million array elements equals eight million bytes.)
I've initialized the control to have one million elements. (Actually, 1,000,001, but who's counting. ;-) Before I run the VI, it is using 1 million bytes for its data--the indicator is an empty array. The profiler won't show you this; it doesn't do its thing until you run the VI.
Okay, once I run the VI, how much memory do you think it takes? Let's see what the profiler says...

Approximately 4 million bytes! What's going on?
In my last blog entry, I said I'd tell you about the three kinds of data in LabVIEW, and they're all showing up in this profile result. The three types of data are...
- Operate Data—Every front panel control and indicator keeps data that we call the "operate data".
- Execute Data—Every wire on the diagram represents a buffer of data. The data for the diagram is called "execute data" or "execution data".
- Transfer Data—Buffer used to isolate execution threads (which work with execution data) from the user interface thread (which works with operate data).
So why do we need these three kinds of data? As we'll see in later postings, the diagram likes to share execution data buffers among parts of the diagram, so the data that originally came from a control can get overwritten with intermediate and final results as the VI executes. You don't want front panel control's data to be changing while the VI runs, though! This means that we have to have a separation between the diagram and the panel.
The transfer buffer is used as an optimization in LabVIEW's multithreaded execution system. When the diagram wants to send data to an indicator, it has to work with LabVIEW's user interface thread to draw the data. There can be many execution threads, but there's only one user interface (UI) thread. Thus, the UI thread can potentially be a big bottleneck if all those execution threads had to sit and wait for it. That's where the transfer buffer comes in. It's a buffer that both the UI thread and execution threads can quickly access without (usually) blocking.
So when a block diagram updates an indicator, the execution data is copied to the transfer buffer by an execution thread, and some time later, the UI thread reads the transfer buffer and copies the data to the operate data.
So back to our example. We have a million bytes in the control (operate data), a million bytes in the control's transfer buffer, a million bytes on the wire (execute data), a million bytes in the indicator's transfer buffer, and a million bytes in the indicator (operate data). That adds up to five million bytes, right?
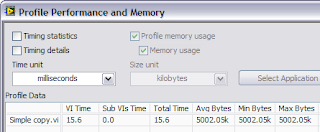
But the profile window said four million. What's the deal? Recall that I said that the profiler does its thing while the VI is running. It turns out that in this simple diagram, the VI stops running before the UI thread has had a chance to make the last copy of the data (from the transfer buffer to the indicator's operate data).
When profiling, I tell people to run their VIs a few times to make sure that buffers are allocated. If I run the VI again, I'll now see five million bytes...

If this were a more realistically complicated VI, there's a good chance that the profiler would have counted all the data the first time.
Next up... I lied. There's a fourth kind of data that can show up in the profile window. What is it?


No comments:
Post a Comment