Thursday, June 21, 2007

Yet another kind of data

Note... I'll be in Vancouver, B.C., for next week's LabVIEW Developer Education Days on June 26. I hope to see some of you there.

As I mentioned last time, there's a fourth kind of data that can show up in the profile window...Default Data.


I'll go back to the simple VI I used in the last posting. It's an array of int8's wired to an array of int8's. The default value of each array is empty. This means that when I load the VI into memory, the front panel doesn't have the arrays allocated. (And the VI only takes up about 8 kilobytes of disk space.) For my earlier profiling tests, I was typing a new value into the millionth element of the array control, which allocates the million bytes for it. When I ran this VI, it consumed five megabytes of data.


Now let's see what happens when I go ahead and "Make Current Value Default" for the million-byte array...


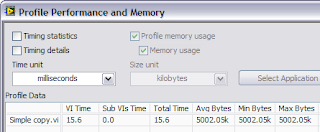
When I run the VI (and I've run it more than once, so you can see the final values in the profile window), you see that the five megabytes has turned into six megabytes. The profile window is now showing you that there's an extra megabyte of memory being consumed by this VI, because of the default data.


To take it a step further, if I also made the indicator array's data the default, I'd be growing the memory consumption to seven megabytes.


Default data is often a good thing, but we sometimes find VIs where we've saved a large amount of data as default accidentally. This is easy to do if you select the "Make All Current Values Default" menu item from the Edit menu. I try to stay away from this menu item, and instead only set the default value for the controls I know that need it.


Pop Quiz: Default data on a front panel control is useful, for example, when the control is on the connector pane, but isn't wired in the caller's diagram. The subVI runs with the default value in that case. When is default data on an indicator useful?

Note that the VI Analyzer reports non-empty default values for arrays so that you can take a closer look at them. (The VI Analyzer is a separate add-on for LabVIEW that can check your VIs for common programming errors, style conformance, and in this case, performance issues.)


Interesting side note... When I save my new test VI to disk, how much disk space do you think it consumes? Seven megabytes? Two megabytes?


It turns out that it takes up about 8 kilobytes, which is about what it took when I hadn't saved any default data. Why is that? It's because my default data was entirely made up of zeros. The VI's data gets compressed when it's saved, and a million zeros compresses very well.


Just for fun, I created an identical VI with a million bytes of random data saved as default data for each front panel array. That VI took about 1.2 megabytes on disk—still, that's a 40% savings over the uncompressed data, which is pretty good, I think. (Your mileage may vary.)


Read more of this article...

Tuesday, June 19, 2007

LabVIEW Performance and Memory Management

When I talk about performance optimization in LabVIEW, I pretty quickly focus on memory management issues. Memory isn't the only concern. It's just that memory issues are sometimes the hardest to understand. Plus, since LabVIEW is a dataflow language, we have a lot of emphasis on the data.


One way to monitor memory usage in LabVIEW is to use the profiler.


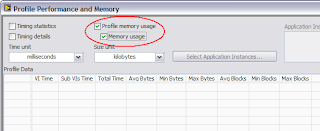
Select Profile Memory Usage to see how much memory each of your VIs is consuming.


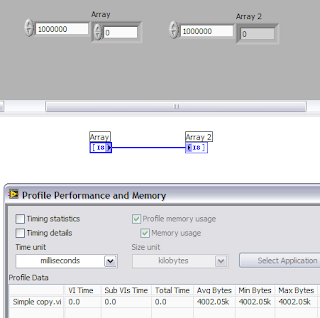
Here's a simple VI I wrote that contains an array control wired to an array indicator. I changed the data type of the array element to be a 1-byte integer. This makes it easy to see how much memory the array is taking--one million array elements equals one million bytes. (If we had an array of doubles, one million array elements equals eight million bytes.)


I've initialized the control to have one million elements. (Actually, 1,000,001, but who's counting. ;-) Before I run the VI, it is using 1 million bytes for its data--the indicator is an empty array. The profiler won't show you this; it doesn't do its thing until you run the VI.


Okay, once I run the VI, how much memory do you think it takes? Let's see what the profiler says...


Approximately 4 million bytes! What's going on?


In my last blog entry, I said I'd tell you about the three kinds of data in LabVIEW, and they're all showing up in this profile result. The three types of data are...


  • Operate Data—Every front panel control and indicator keeps data that we call the "operate data".

  • Execute Data—Every wire on the diagram represents a buffer of data. The data for the diagram is called "execute data" or "execution data".

  • Transfer Data—Buffer used to isolate execution threads (which work with execution data) from the user interface thread (which works with operate data).


So why do we need these three kinds of data? As we'll see in later postings, the diagram likes to share execution data buffers among parts of the diagram, so the data that originally came from a control can get overwritten with intermediate and final results as the VI executes. You don't want front panel control's data to be changing while the VI runs, though! This means that we have to have a separation between the diagram and the panel.


The transfer buffer is used as an optimization in LabVIEW's multithreaded execution system. When the diagram wants to send data to an indicator, it has to work with LabVIEW's user interface thread to draw the data. There can be many execution threads, but there's only one user interface (UI) thread. Thus, the UI thread can potentially be a big bottleneck if all those execution threads had to sit and wait for it. That's where the transfer buffer comes in. It's a buffer that both the UI thread and execution threads can quickly access without (usually) blocking.


So when a block diagram updates an indicator, the execution data is copied to the transfer buffer by an execution thread, and some time later, the UI thread reads the transfer buffer and copies the data to the operate data.


So back to our example. We have a million bytes in the control (operate data), a million bytes in the control's transfer buffer, a million bytes on the wire (execute data), a million bytes in the indicator's transfer buffer, and a million bytes in the indicator (operate data). That adds up to five million bytes, right?


But the profile window said four million. What's the deal? Recall that I said that the profiler does its thing while the VI is running. It turns out that in this simple diagram, the VI stops running before the UI thread has had a chance to make the last copy of the data (from the transfer buffer to the indicator's operate data).


When profiling, I tell people to run their VIs a few times to make sure that buffers are allocated. If I run the VI again, I'll now see five million bytes...


If this were a more realistically complicated VI, there's a good chance that the profiler would have counted all the data the first time.


Next up... I lied. There's a fourth kind of data that can show up in the profile window. What is it?


Read more of this article...

Wednesday, June 13, 2007

LabVIEW Performance, The Early Years

I started working at NI in 1988, when LabVIEW 1 was shipping. LabVIEW 1 was so cool. But once you got past the awesome (for the 1980's) graphics and graphical programming paradigm and started to use it for real work, you noticed that it was a tad slow.


We learned a lot doing LabVIEW 1. So much so that we decided to throw away the source code and start over with LabVIEW 2. While LabVIEW 1 was an interpreted language, LabVIEW 2 was built from the ground up to be compiled. And when it came out in 1990, LabVIEW 2.0 demonstrated much better performance. For some applications, it was an order of magnitude or more faster. (So fast, in fact, that we ran into problems talking to many GPIB instruments that couldn't keep up with commands we were sending.)


LabVIEW 3 released in late 1993, and was the first version of LabVIEW that unified our original Macintosh codebase with our PC and Sun versions. Soon after, I created the first presentation to customers about LabVIEW performance...


In May 1994, I was invited to Sweden to present "Tips & Techniques for Improving LabVIEW Performance". It discussed how to take advantage of the many performance optimizations available in LabVIEW, and also discussed patterns to avoid, such as local variables. (Don't worry, I'll cover these in subsequent postings.)


My presentation was based on some earlier technical notes, as well as an article by Monnie Anderson in the now defunct LabVIEW Technical Resource. (LabVIEW Memory Secrets, Volume 2, Number 1, Winter 1994)


Before I left for Stockholm, I practiced the presentation in front of the LabVIEW team. This turned out to be a great experience—I presented to the toughest audience first. It did yield one unexpected result: the LabVIEW development team did not agree on how LabVIEW worked!


More precisely, I had found a common situation where LabVIEW made an extra copy of data that unexpected and unnecessary. Within a few days, our compiler expert had a fix that later came out in LabVIEW 3.1.


Why am I telling you these stories? Even though the latest LabVIEW is many orders of magnitude faster than LabVIEW 1, and even though we can handle much more complicated applications than we could a couple of decades ago, we're not resting. We're still working on performance issues today.


For example, we've seen much growth in the use of multi-core processors in affordable PCs. While LabVIEW has been ahead of this curve and able to take advantages of multiple processors and cores since our 1998 release of LabVIEW 5.0, we're continuing to look at new ways to leverage all this computing power.


Another reason for these stories is to make it clear that performance issues are sometimes difficult to understand. And I'm hoping that my future blog posts will help clarify these for you.


Next up... The three kinds of data in LabVIEW.


Read more of this article...

Tuesday, June 12, 2007

Expanding Scope

I returned recently from a couple of trips lamenting that I haven't been keeping this blog current. I was visiting customers in Massachusetts, Connecticut, and Colorado, discussing topics ranging from "performance optimization" to "software engineering". It occurred to me that my blog's current focus isn't keeping up with my everyday work life.


I spend a lot of my day at NI working on "next year's LabVIEW". It's cool stuff. You'll like it. But it doesn't produce much fodder for my blog, because I can't talk about specifics yet. Also, my current project is pretty far-reaching, and doesn't fit neatly into just "data acquisition and instrument control".


So, I'm going to start expanding the scope of my blog a little to cover a few more topics that I care about—and that many of you have told me that you care about, too.


Coming soon... The first of several postings about performance issues. If you have other LabVIEW-related topics you'd like me to cover, please post a comment or send an email.


Read more of this article...